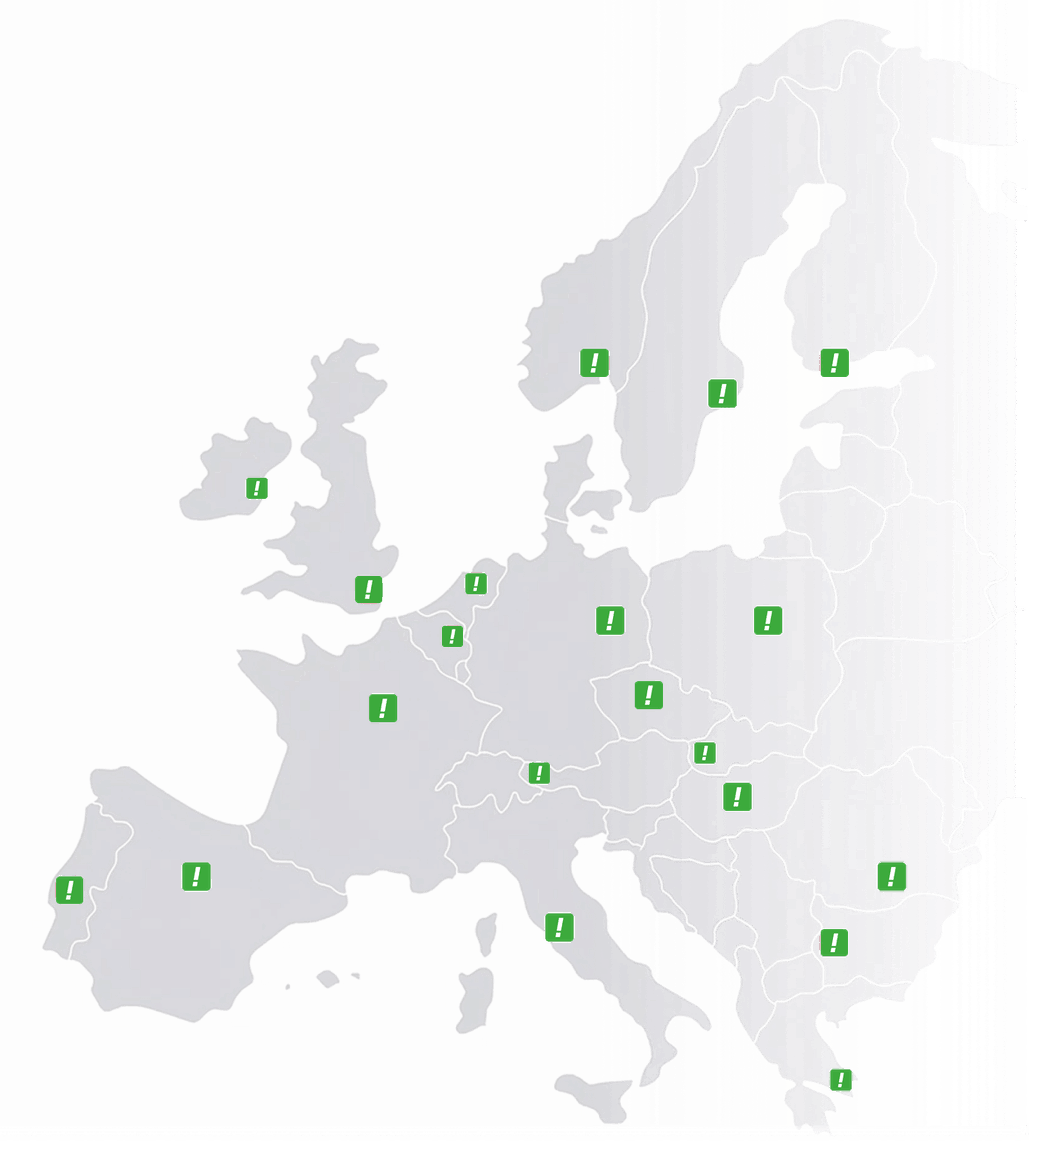
Netherlands
 Belgium
 Denmark
 Germany
 France
 United States
 Austria
 UK
 Spain
 Italy
In the dashboard, at the top of the Statistics page. Many number owners want to know what share of their calls comes in outside business hours, or how many calls come from mobile phones. Our real-time call statistics show this at a glance.
Peak and off-peak, mobile and landline graphs
Log in to the dashboard and go to Statistics.
At the top of the page, graphs show the share of calls during peak and off-peak hours, and the share of calls from mobile phones and from landlines.

More breakdowns
Further down, graphs show your calls by day of the week, the top 3 busiest hours, where your callers are located and your top destinations.
Together, these statistics show how your number is performing and when your team is busiest.