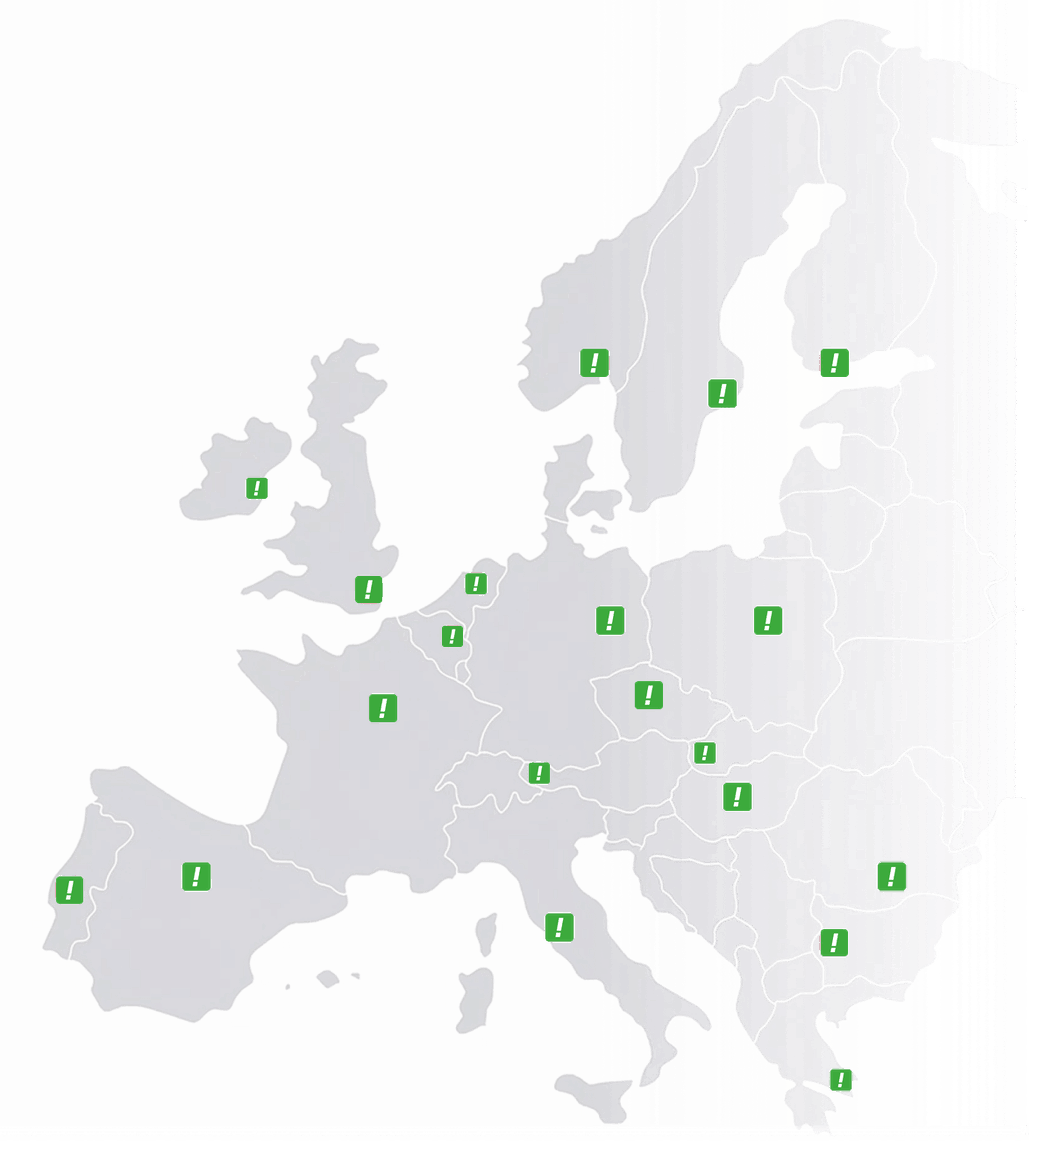
Netherlands
 Belgium
 Denmark
 Germany
 France
 United States
 Austria
 UK
 Spain
 Italy
Your dashboard shows your call statistics in real time. Choose a period (today, last week, last month, or any period up to one year back) and you see everything at a glance.
What you see
- Average talk time: how long your calls last on average
- Total calls: the total number of incoming calls for the selected period
- Fixed vs mobile: how many calls came from landlines and how many from mobile phones
- Peak and off-peak: the split between calls during and outside business hours
Top 10 overviews
- Top 10 endpoints: which branches or team members receive the most calls, so you can see how the work is distributed
- Top 10 callers: who calls you most often, useful for identifying key customers or repeat callers
- Top 10 cities and areas: where your callers are located, useful for tracking regional marketing
Busiest hours
The dashboard shows your top 3 busiest hours, so you know when you need the most people available to take calls.
Call distribution charts
Two detailed charts give you a closer look:
- Talk time distribution: how many calls lasted 0–1 minutes, 1–2 minutes, 2–3 minutes and so on, up to 10+ minutes. This shows whether calls are quick questions or longer conversations.
- Calls per hour: the number of calls in each hour of the day, so you can see exactly when your phone is busiest and plan your staffing.
Export your data
If you need to work with the data outside the dashboard, go to Statistics → Specification and click Download as Excel. All data for the selected period is exported into a single file for your own analysis, reports or charts.
You can also receive your statistics automatically by email; see email reports.